How to Set Up GA4 Conversion Rate in Looker Studio
Roy Bielewicz
Calculated metrics in Looker Studio are your GA4 conversion friend.
If you're using Google Analytics 4 (GA4) to track your website's performance, you may want to use Looker Studio (formerly Data Studio) to create reports and visualize your data.
Looker Studio is a handy, free data visualization tool that allows you to connect to your GA4 data (as well as Google Ads, and other data sources) and create customized reports and dashboards. One important metric that you may want to track, which isn't readily available in GA4 is your website's conversion rate.
We'll walk you through the steps to set up conversion rates for GA4 in Data Studio.
Update: Conversion Rate is now available as a metric in Looker Studio, as either User Conversion Rate or Session Conversion Rate. However, this pre-calculated metric includes all events that have been identified as a "conversion" in GA4. For many businesses, especially retail, you'll want to continue to calculate specific conversion events as your "conversion rate". In other words, if a user registration, email signup, etc., is a "conversion" in GA4, you will probably just want to include "Transactions" since that is the typical definition of conversion rate.
1) Connect GA4 to Looker Studio
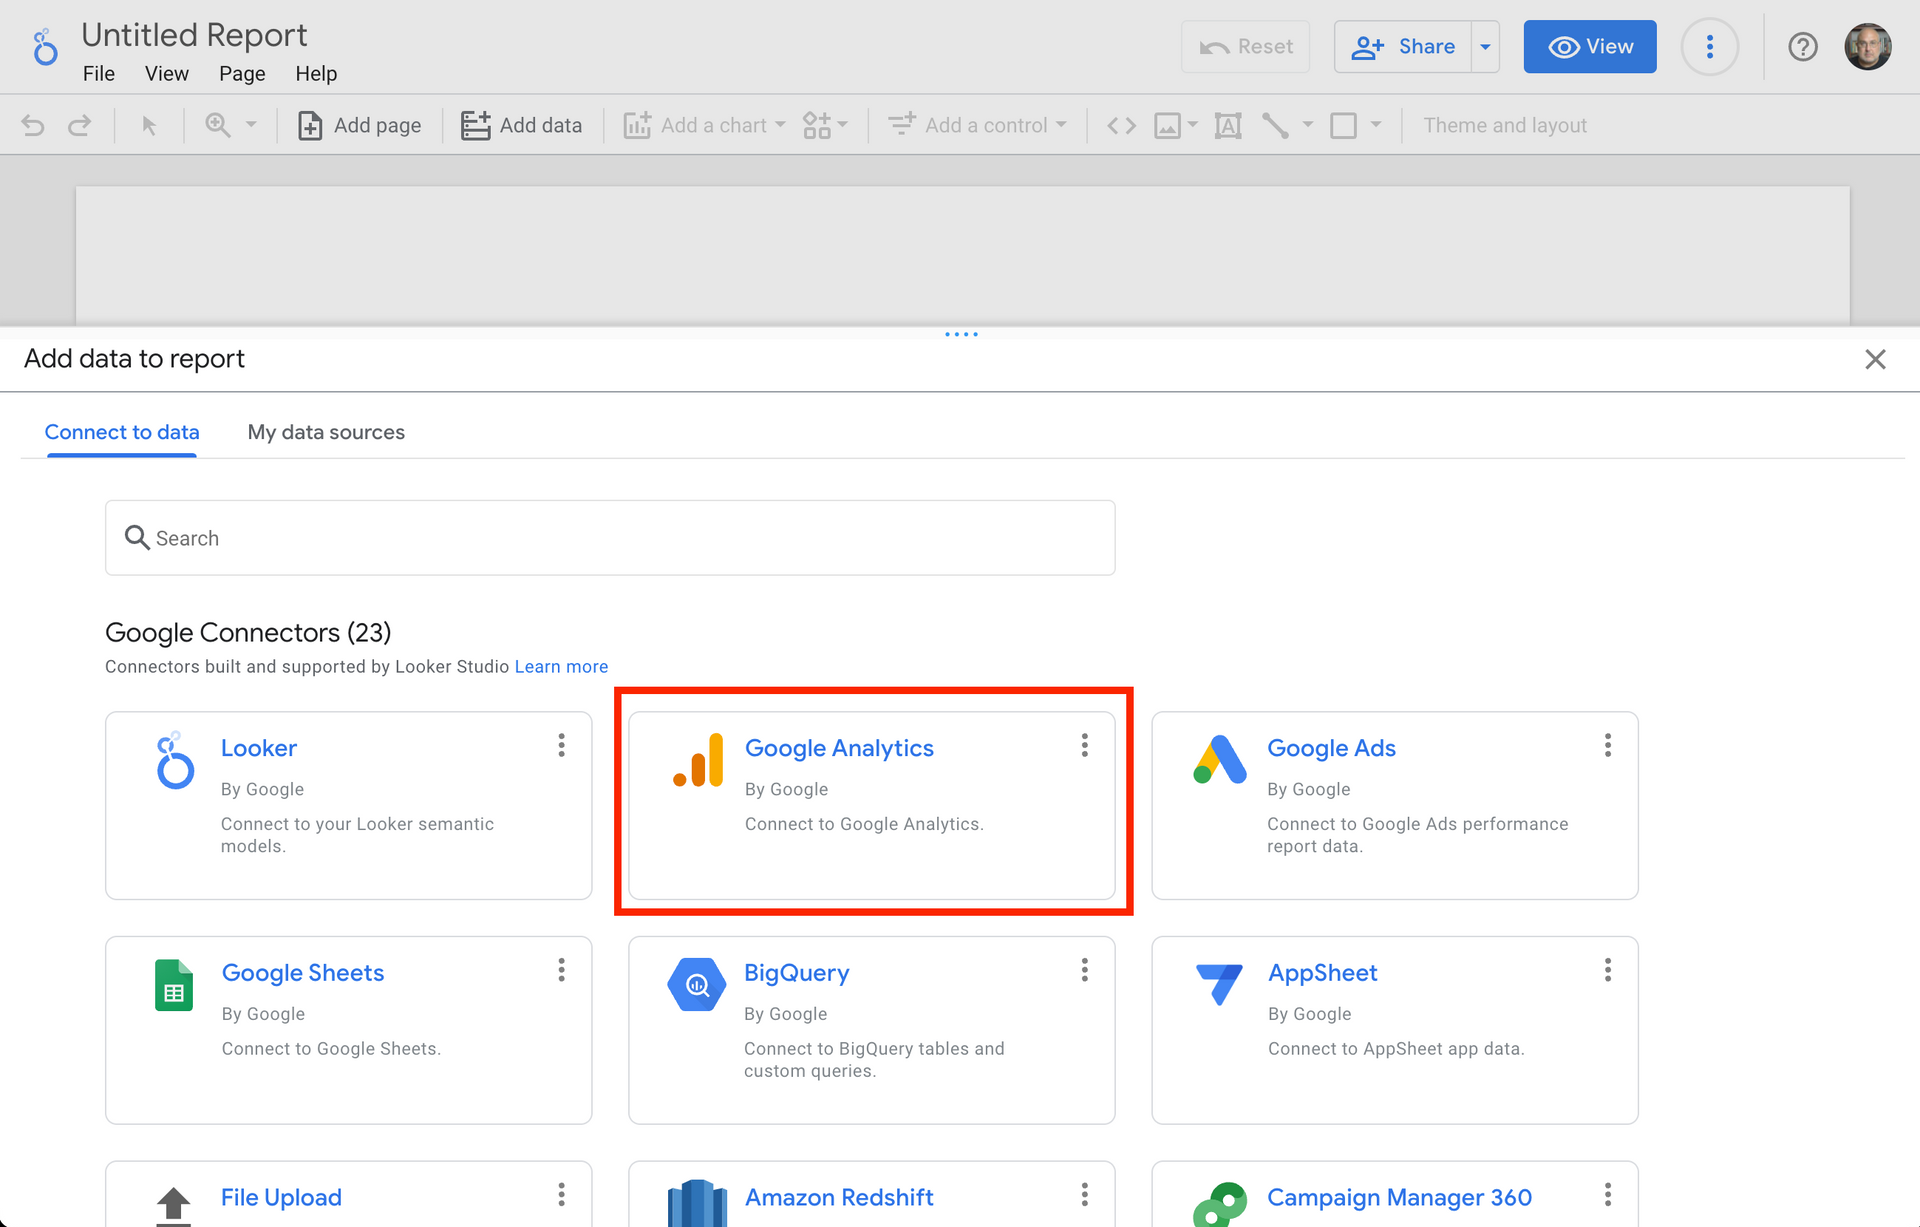
The first step to setting up conversion rates in Looker Studio is to connect your GA4 property to your dashboard. To do this, click on "Create" in the top left corner of your Looker Studio account, and select "Data Source" from the dropdown menu. From there, select "Google Analytics" as your data source. You'll then be prompted to select the appropriate GA4 property.
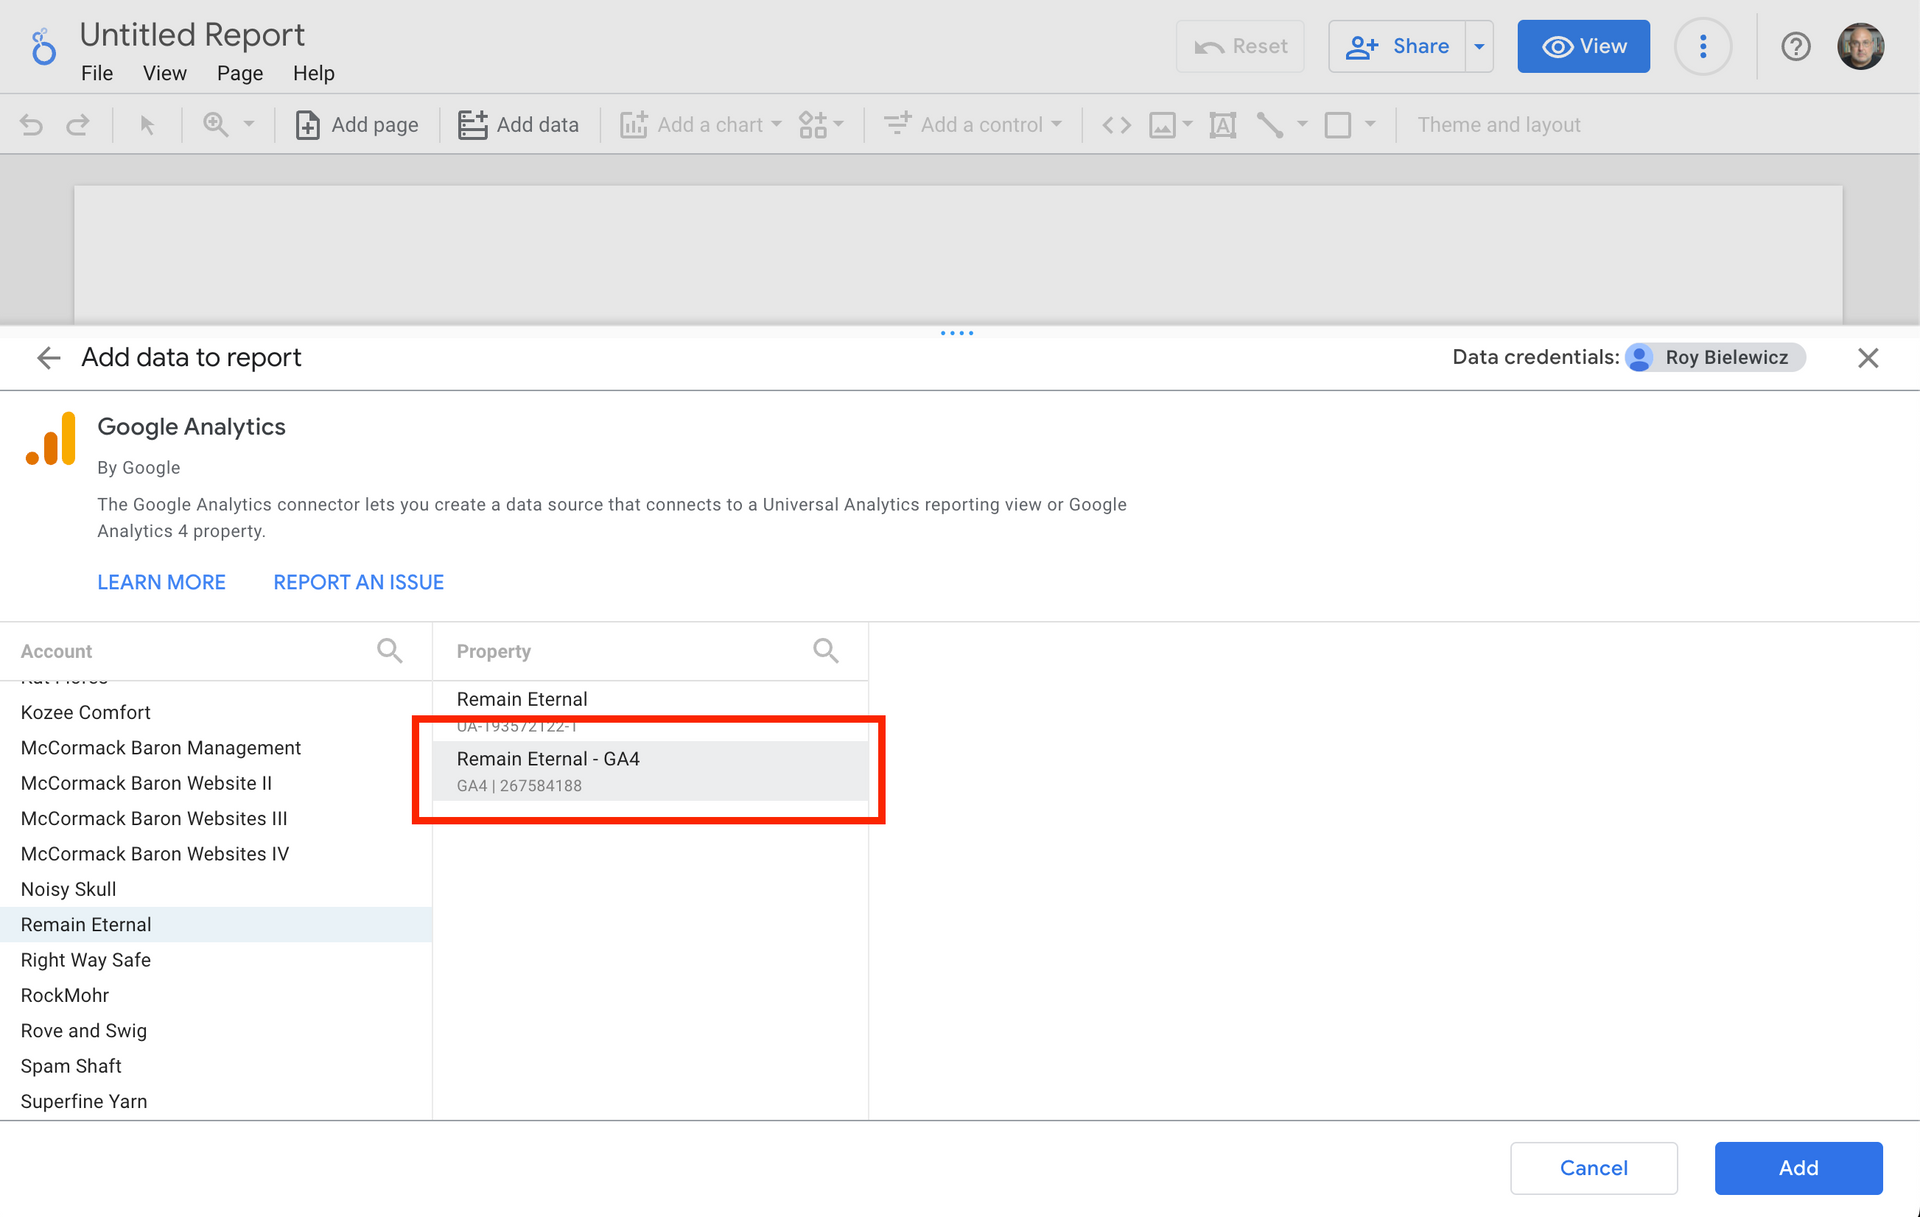
Once you connect Google Analytics, select the property for your report. Note: You can have multiple properties and data sources in a single dashboard. This is particularly useful if you're comparing metrics between websites, or pulling in data from other sources such as Google Search Console or Google Ads.
2) Create a Report
Once you've connected your GA4 property to Data Studio, create a new report or open an existing one.
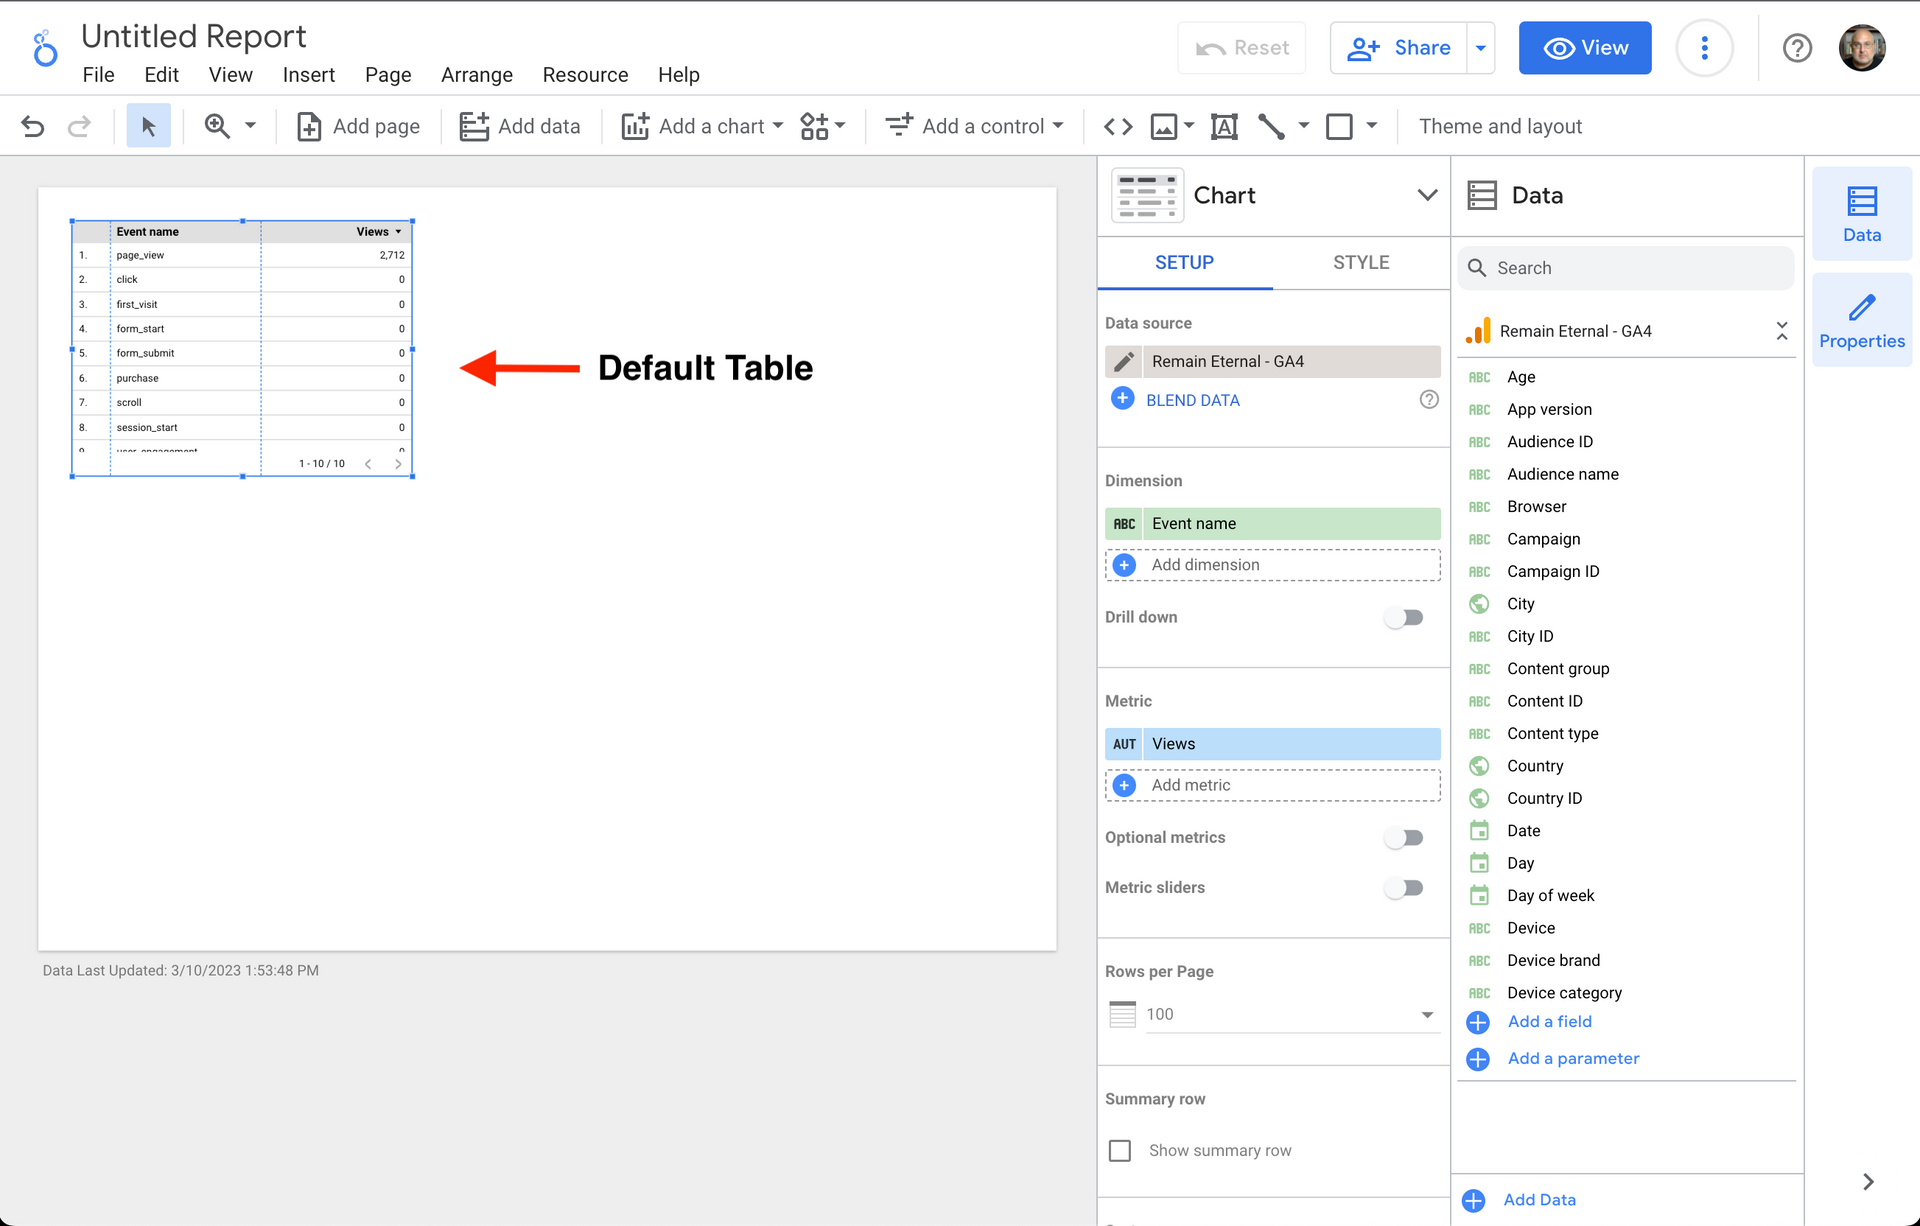
When creating a new report, it will be populated with a default table. You can just click on it and delete if if desired.
3) Select Your Card Type
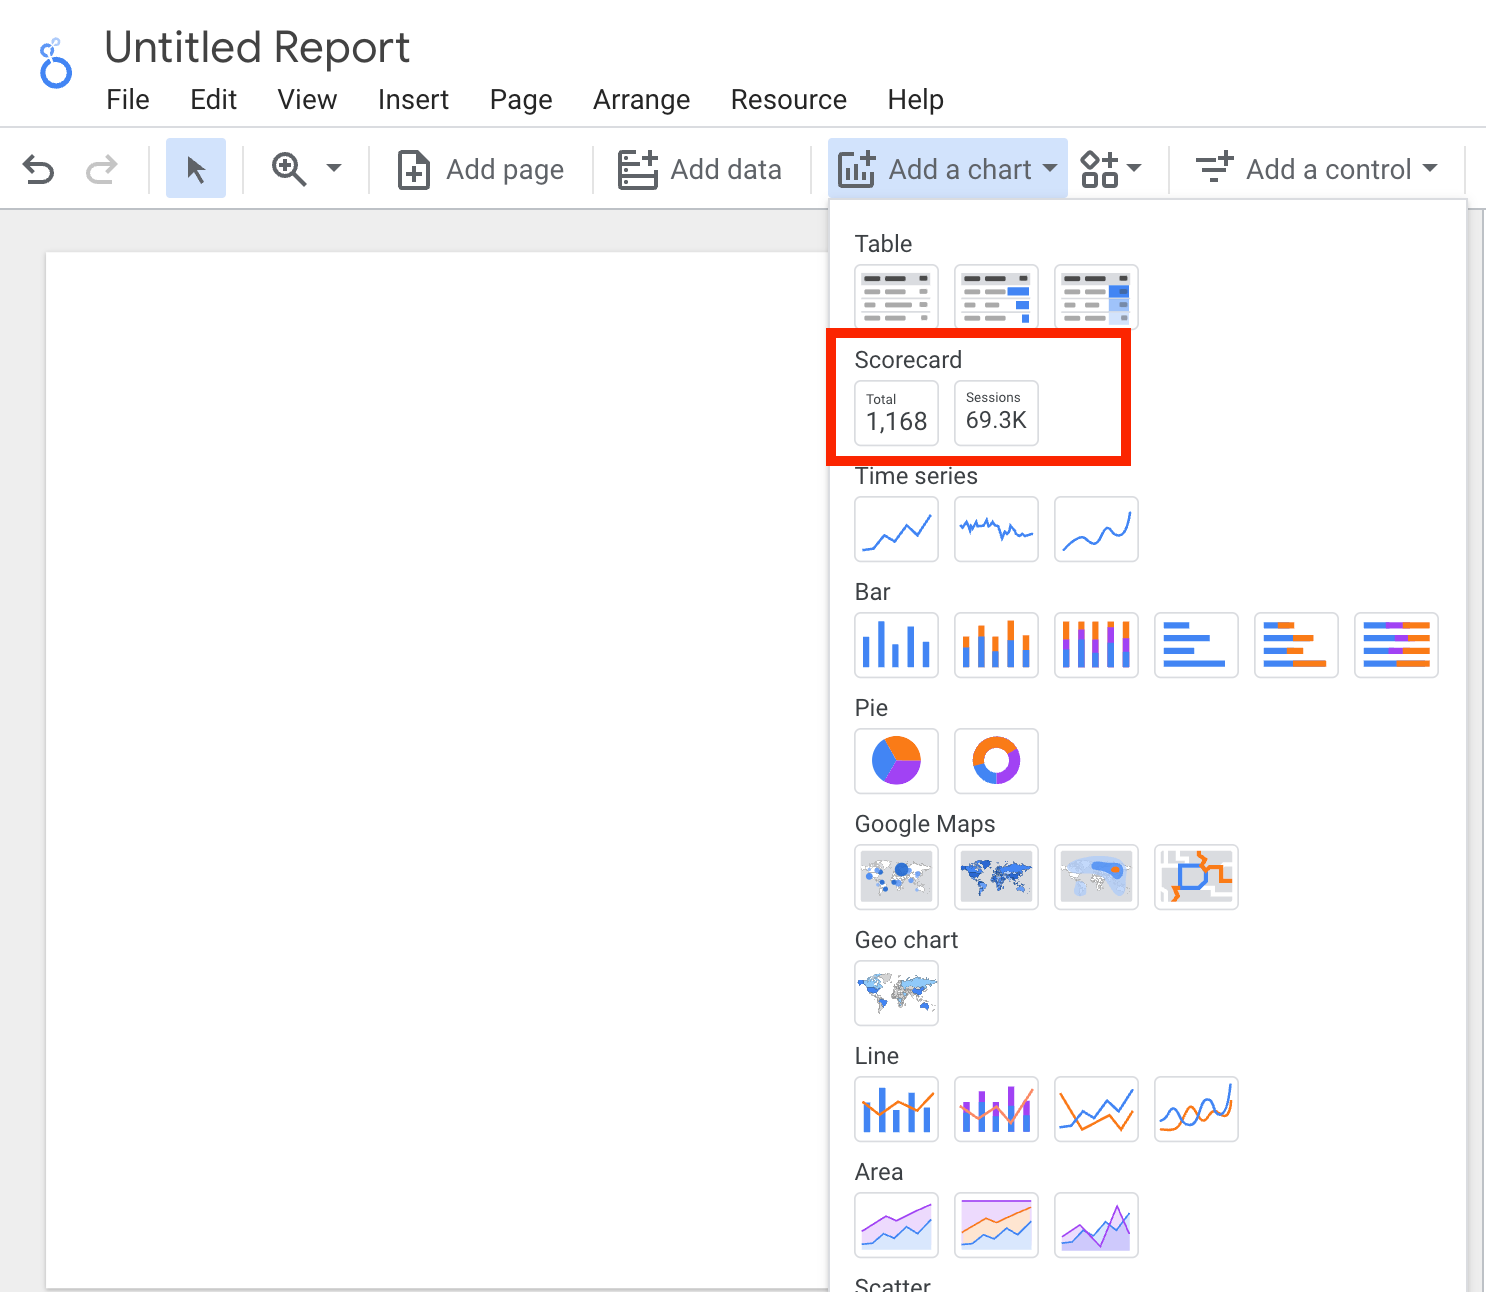
Under the "Add a chart" tab, select the format that you would like. In this case, we'll be using a scorecard to show a single specific metric, conversion rate.
4) Create Your Metrics
In the metrics section, you'll notice that conversion rate is not available as a predefined metric. Transactions and sessions, are available, however. That means that we need to create a calculated metrics.
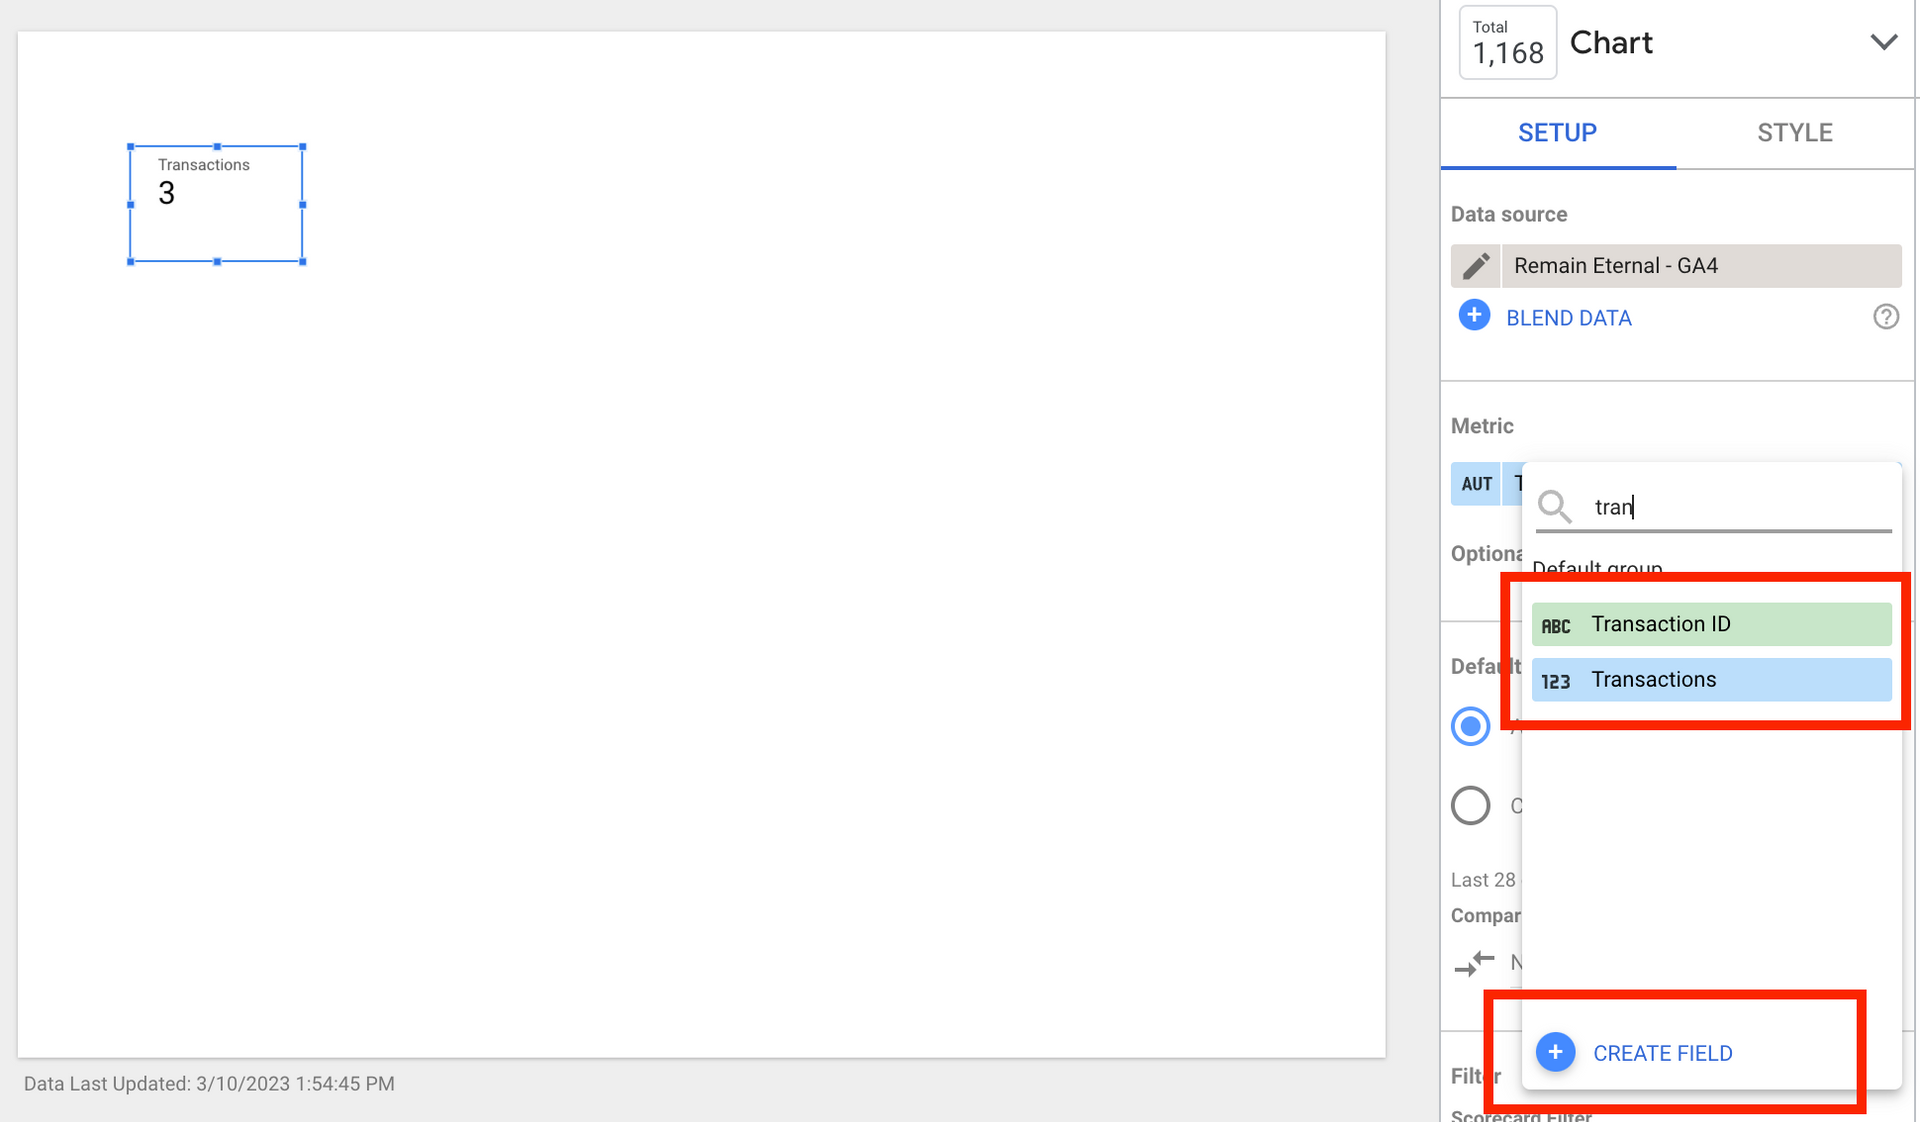
Since conversion rate isn't available, you'll need to click on "Create Field" and create a calculated metric.
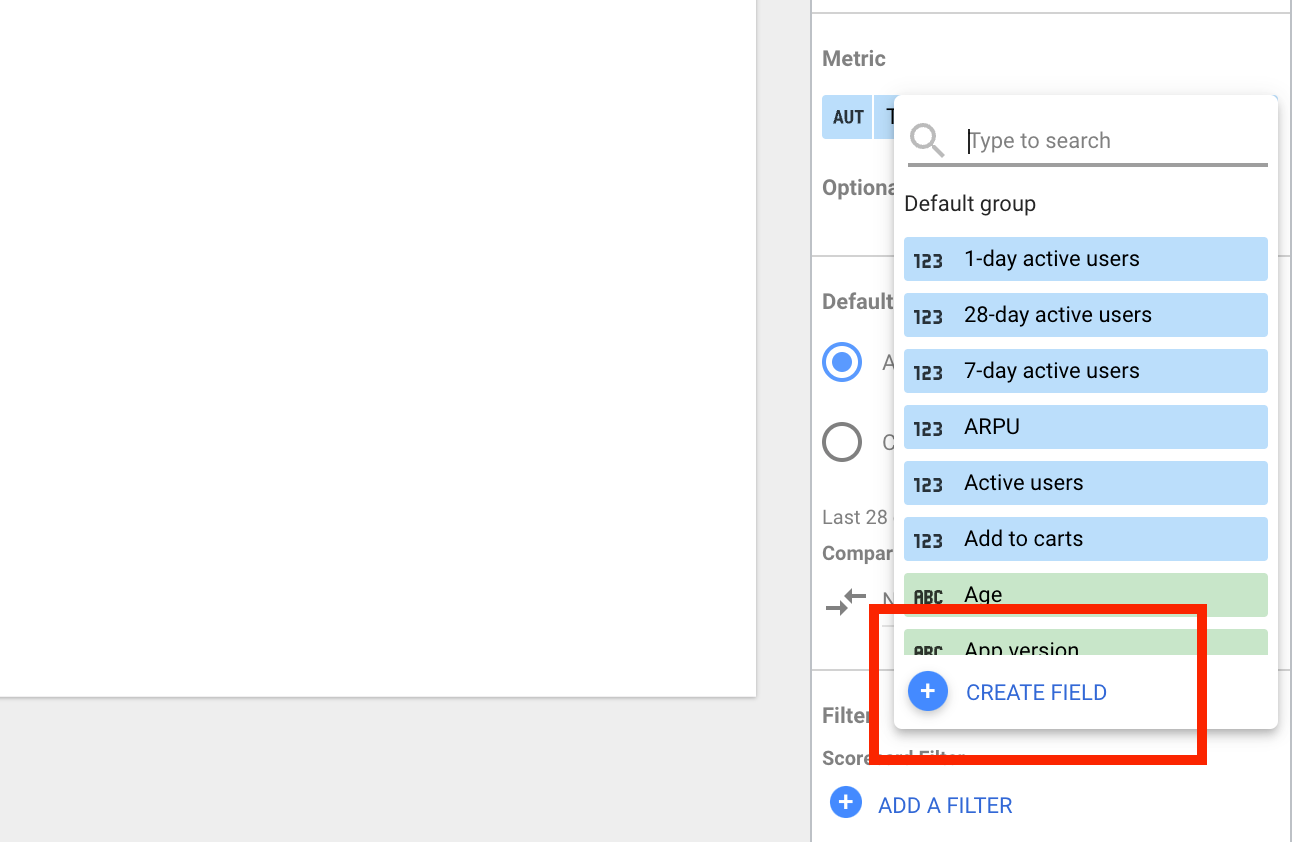
In this case, we'll want to select "Transactions" (which are orders), and divide that by "Sessions" (you can also use "Users" if you prefer to use that when calculating conversion rate).
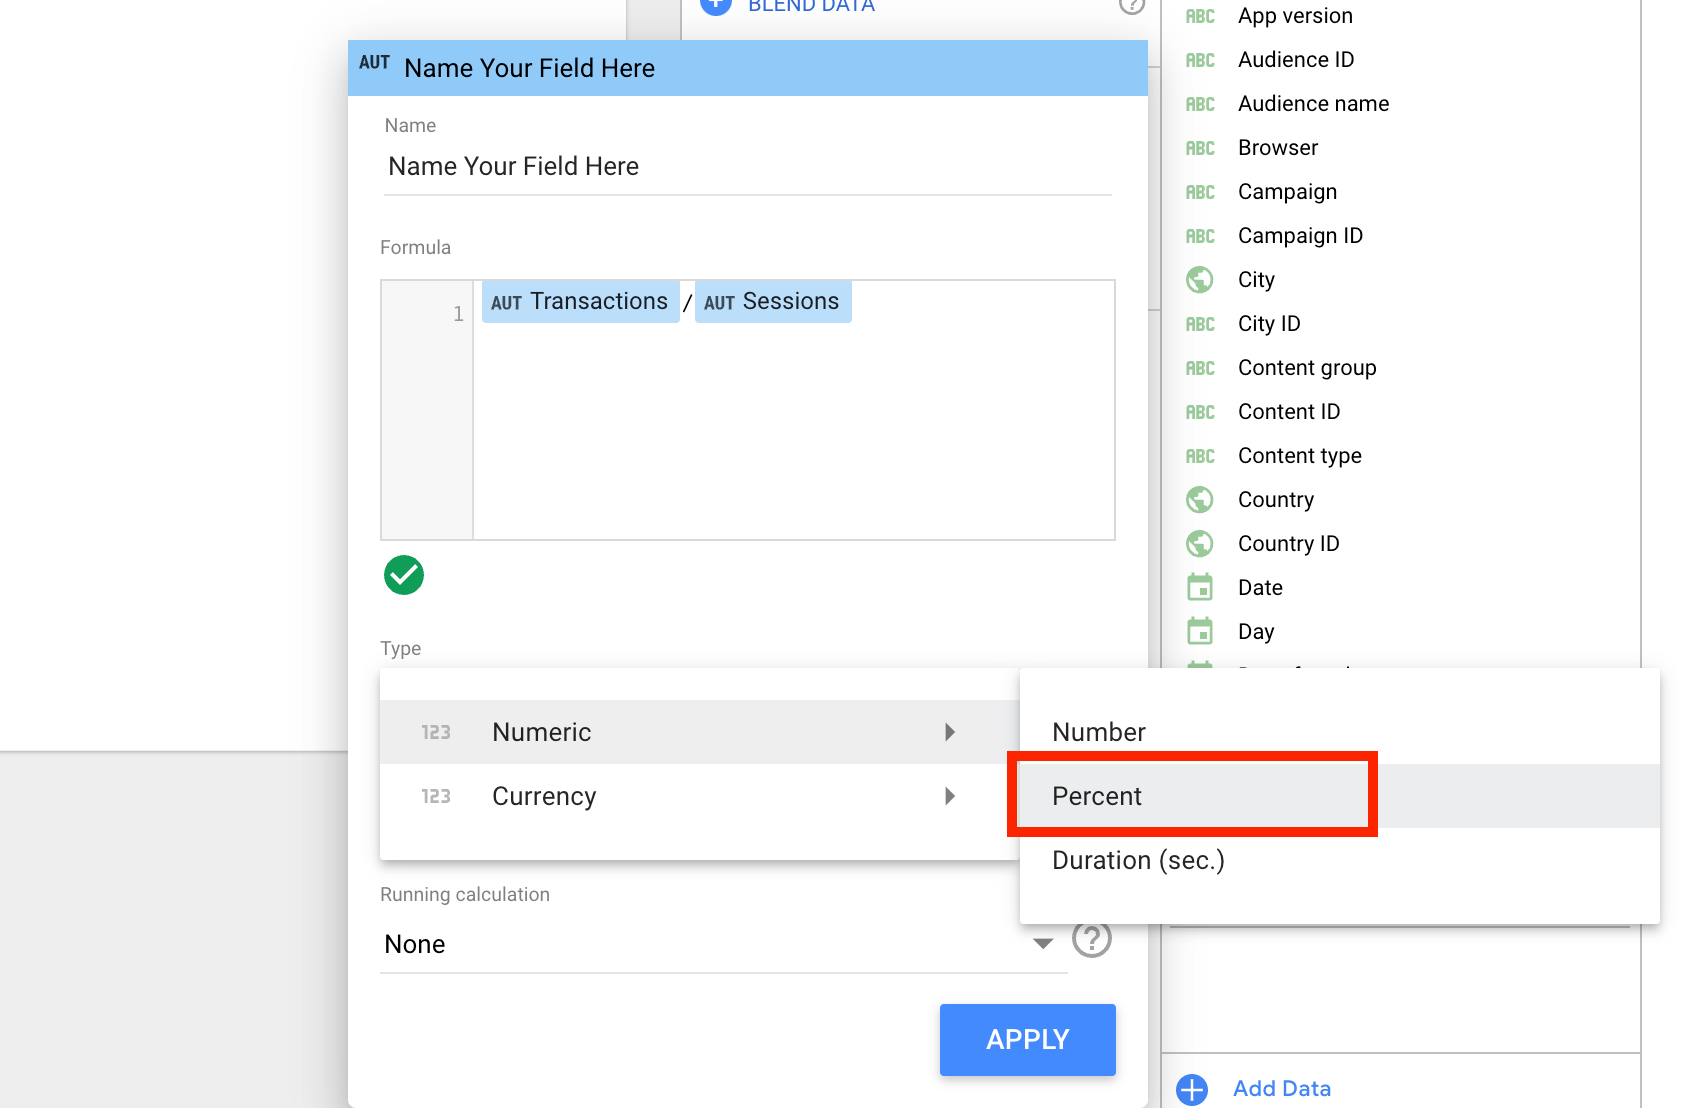
Be sure to format your new calculated metric correctly. In the "Type" box, select "Numeric" and then choose "Percent". Then click "Apply".
5) Name Your Metric
Now that you've created your calculated metric for conversion rate, you'll want to name it so that your card has the correct label. You do that by entering a new name in the "Name" field of your calculated metric.
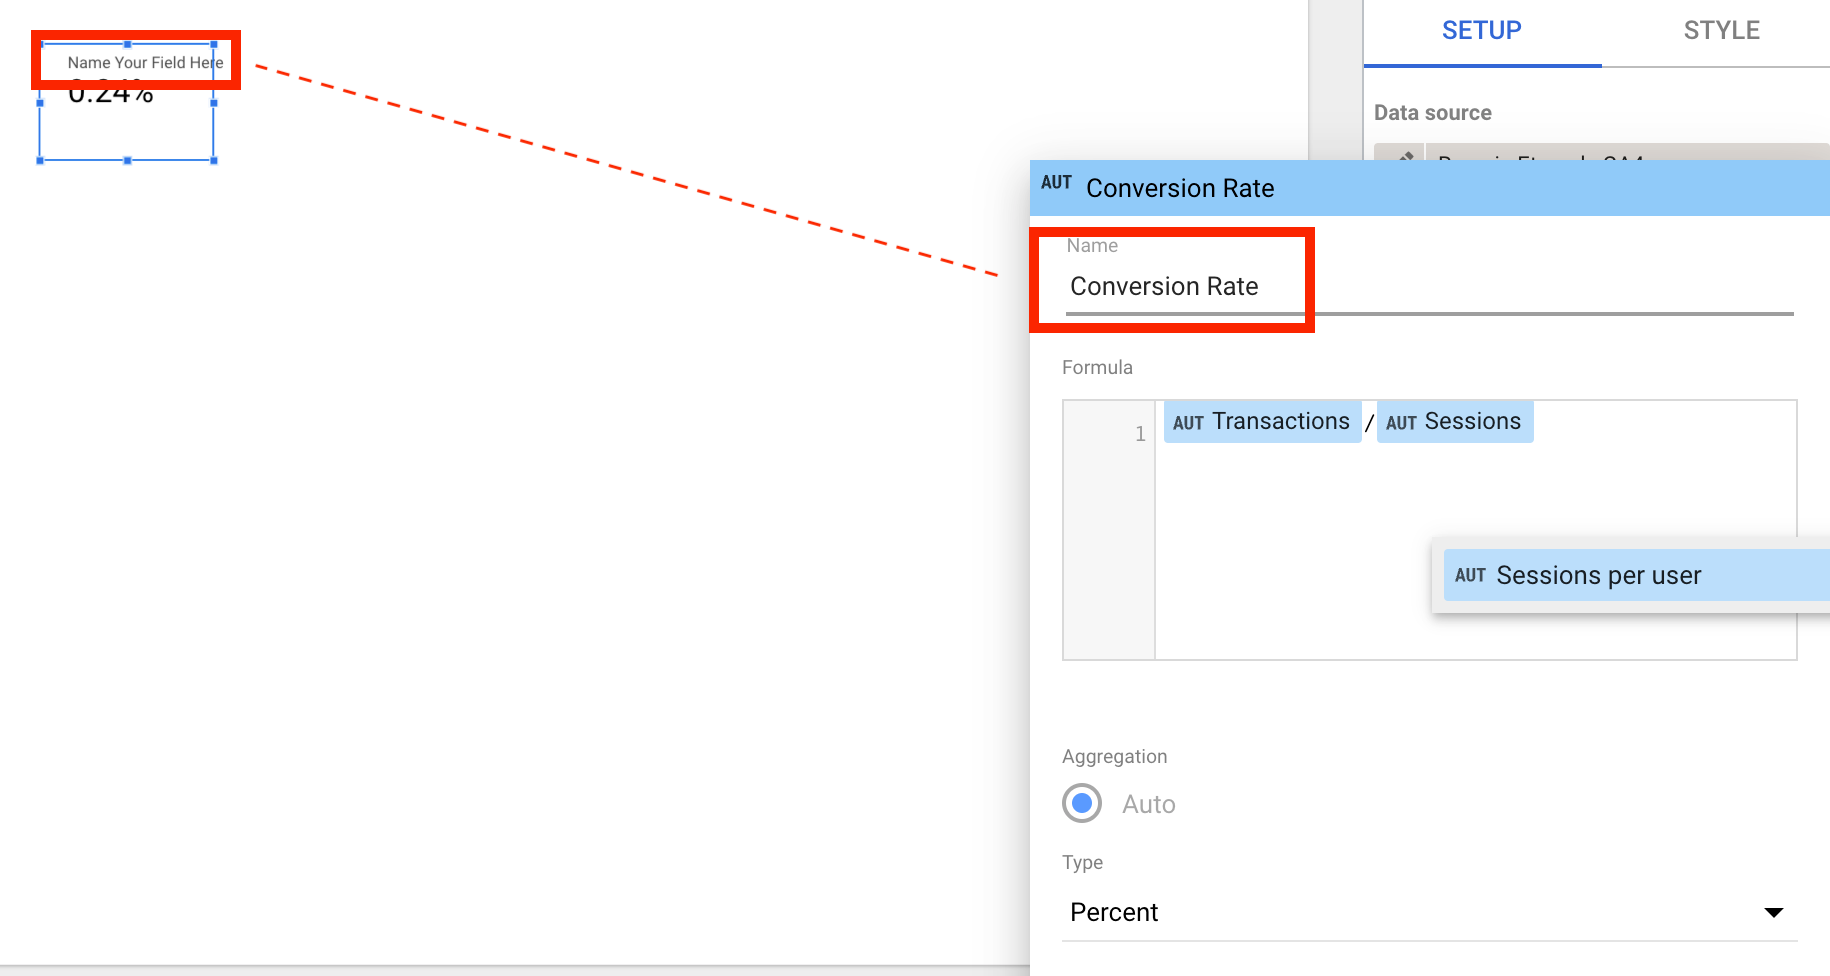
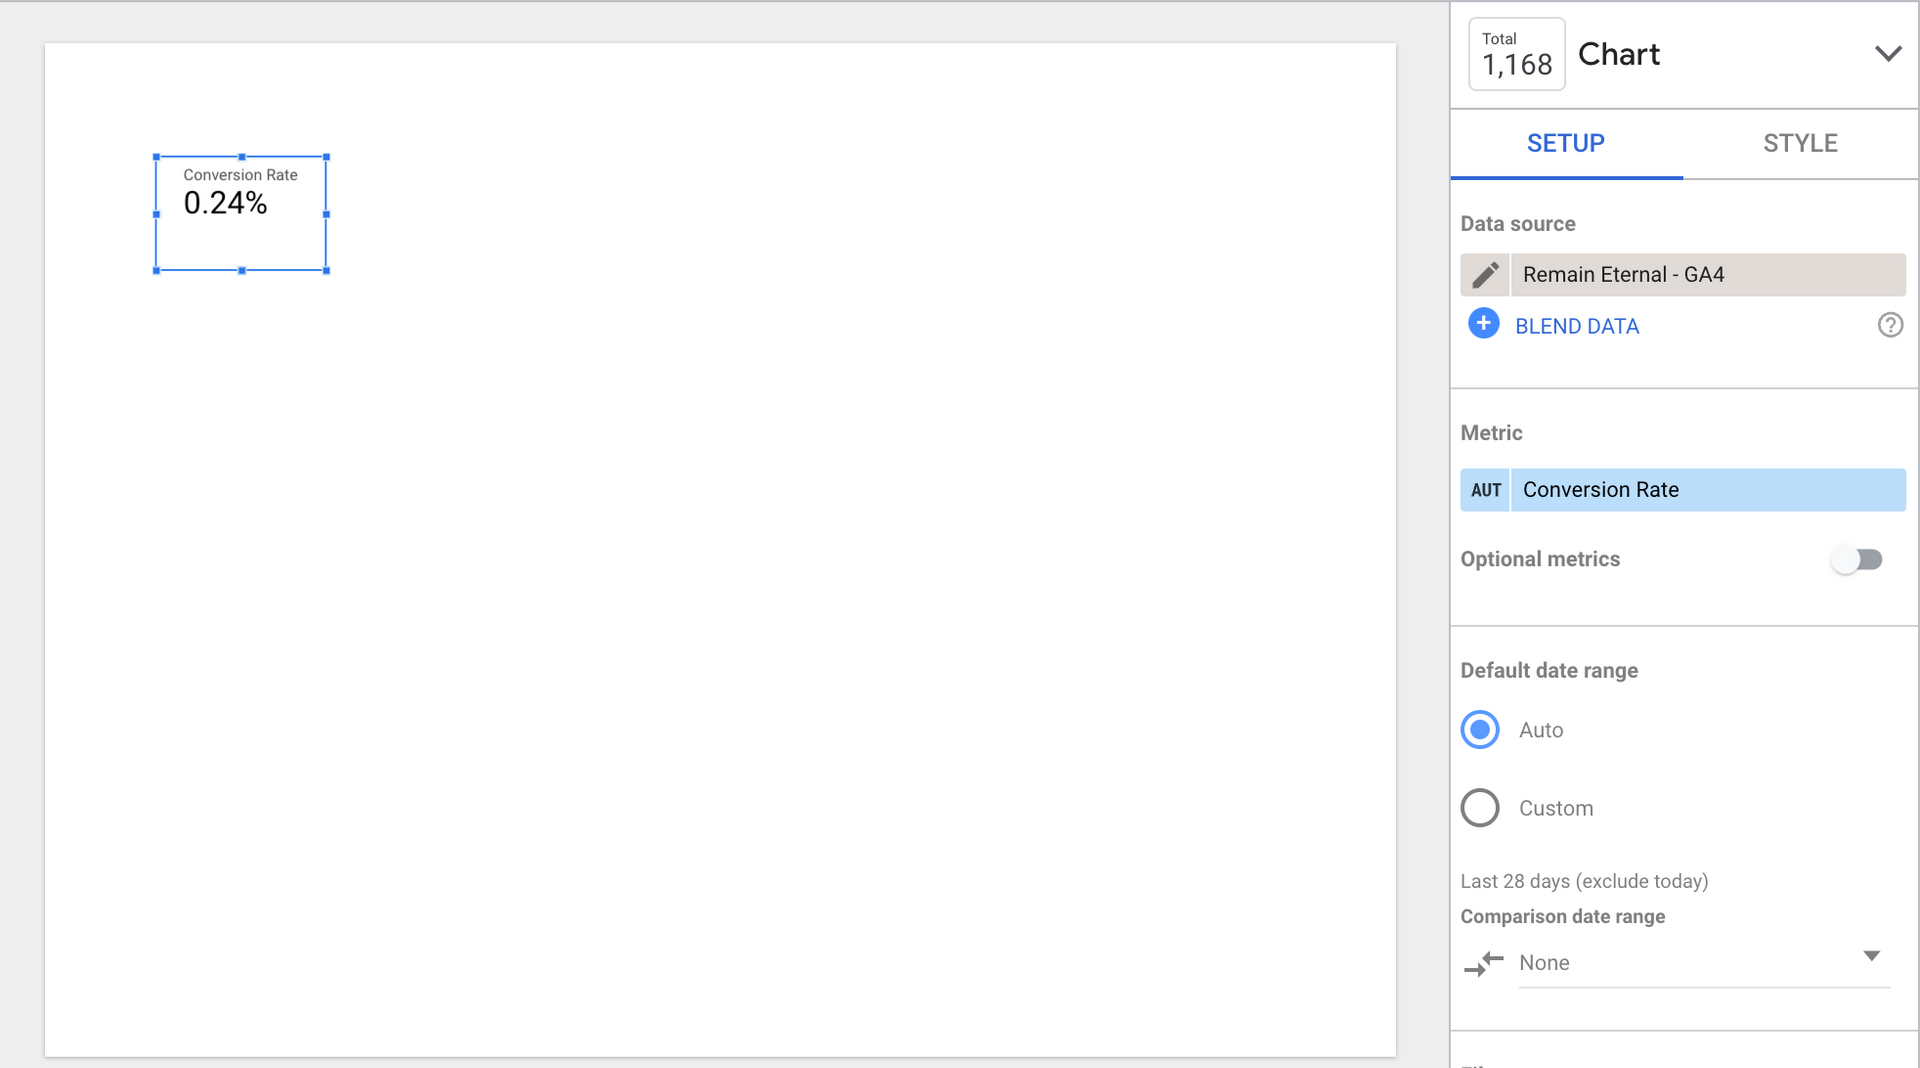
6) Voilà!
Now you have a card that shows your website's conversion rate using GA4 data! You can now create other calculated metrics using the same process.
Contact Us


