GA4 UPDATE: Annotations are back!
Roy Bielewicz
Keep track of events and campaigns that impact your reporting.
If you’ve spent any time working in Google Analytics—especially the older Universal Analytics version—you’ll remember a super handy feature called annotations. These were little notes you could add to your reports to mark important events: maybe your site went down for a day, or a new campaign launched, or you rolled out a big update.
These annotations were lifesavers when it came to making sense of sudden traffic spikes or mysterious conversion drops. “Oh right, that was the day our email campaign launched!” or “That’s when the tagging broke…” You get the idea.
Well, here’s the good news: annotations are back in GA4—finally!
Wait…What Are Annotations Again?
Let’s back up a bit. If you’re new to GA or maybe didn’t use Universal Analytics much, annotations are basically digital sticky notes for your reports. You can record:
- Marketing campaign launches
- Website outages
- Tracking/tagging issues
- Promotions or seasonal events
- Product launches
- Algorithm updates
- Anything else that might affect your website data
And it’s not just for solo marketers—annotations are a must-have for teams. Why? Because not everyone knows what’s going on all the time. Your SEO team might not know the email team pushed out a flash sale. Your devs might’ve fixed a bug that tanked the bounce rate. These little notes create a shared record of what happened and when.
In short: annotations help you remember why something happened, not just that it happened.
GA4 Took Them Away. But Now They're Back!
For reasons only Google knows (and isn’t sharing), annotations didn’t make the cut when they rolled out GA4. Cue the collective groan from marketers and analysts everywhere.
Sure, there were workarounds. People used Google Sheets, Notion, internal dashboards—you name it. We even did a video about how you can add annotations in Looker Studio. But none of that was as simple or as connected as the built-in feature we lost.
Now, finally, annotations are back in GA4. And they’re actually kind of nice.
Let’s walk through how to use them, and how you can make them work for your team.

How to Use Annotations in GA4
Using annotations in GA4 is easy once you know where to look. Here’s a quick step-by-step.
Step 1: Look for the Annotations Icon
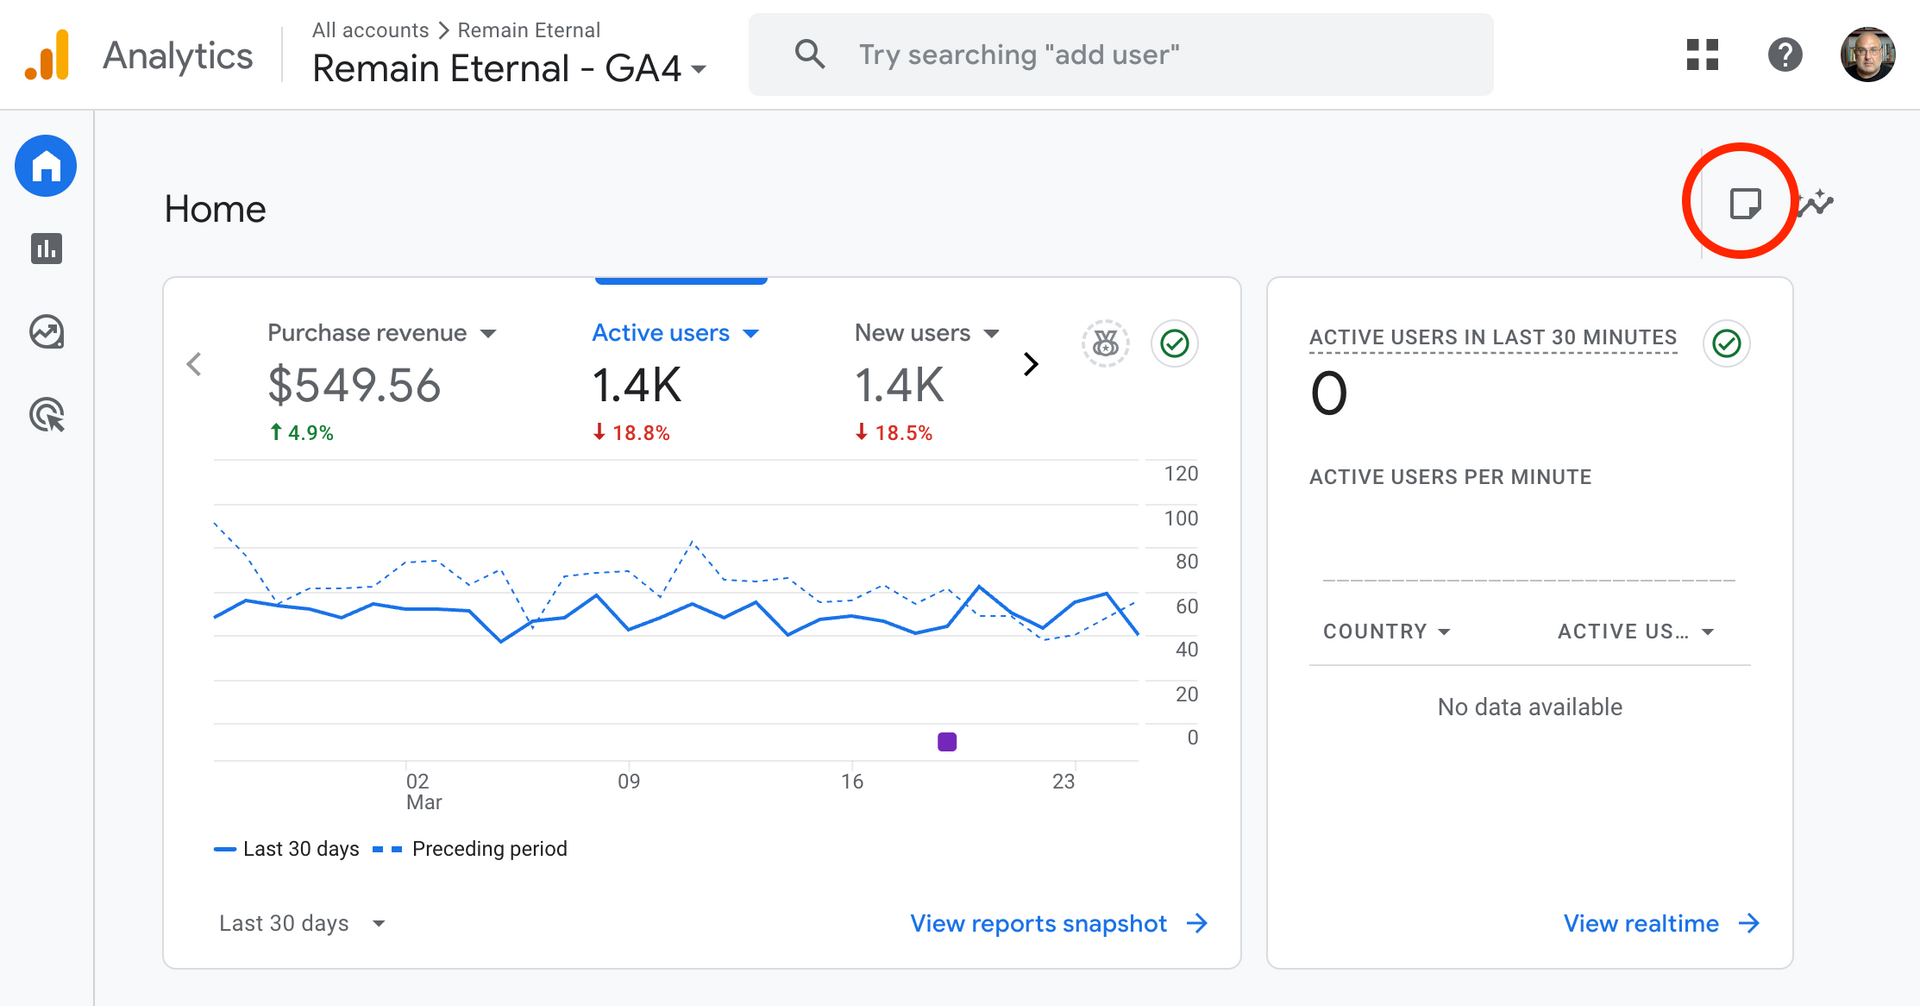
Head over to your GA4 property and check out any of your main reports—like the Home report or the Traffic Acquisition report. You’ll see a small page icon with a little folded corner. That’s the annotations icon.
Good news: annotations should be available in most of your high-traffic reports. Bad news: they don’t show up in Explorations (custom reports). Yeah, we don’t get it either. Hopefully that changes soon.
Step 2: Create Your Annotation
Click that icon, and then hit “Create annotation.” You’ll be prompted to enter:
- Title: Keep it short but descriptive. Example: “March Email Campaign: Sales Launch”
- Description: Go into a bit more detail—what happened, what was the goal, etc.
- Date or Date Range: You can choose a single date (like a one-day outage) or a range (like a two-week campaign).
- Color Coding: This is where things get interesting.
Step 3: Use Color Coding for Context
Each annotation shows up as a little dot on your timeline, and that dot can be color-coded. This is your opportunity to bring order to the chaos.
Our recommendation? Come up with a standard color code for your team. Something like:
- 🔴 Red for emergencies (site outages, broken tracking)
- 🟢 Green for paid search launches
- 🔵 Blue for email campaigns
- 🟡 Yellow for SEO updates
- 🟣 Purple for offline events (TV, radio, print
Whatever your system is, keep it consistent. If you’re part of a larger team, document the color codes and naming conventions somewhere easy to find.
That way, anyone looking at reports can quickly scan the chart and say, “Oh hey, there was a red-dot outage here,” or “Looks like the blue-dot email campaign went out then.”
Where Do Annotations Show Up?
After you save an annotation, it appears directly on your chart as a small colored dot on the date (or start of the date range). Hover over it, and you'll see the title and summary.
These annotations are visible across most standard reports—including:
- Home
- Traffic Acquisition
- Pages & Screens
- Events
- Conversions
You’ll be able to hover over the dot to see a snapshot of what happened. It’s a fast and easy way to get context as you scroll through your data.
Better yet, annotations are persistent—they don’t go away unless you delete them. That means they’re always there to help your future self (or teammates) understand what was happening when the numbers changed.
Why Annotations Matter (Especially for Teams)
Still wondering if annotations are worth the effort? Let’s walk through some real-world use cases.
1. Prevent Team Confusion
Ever had a team member ask, “Why did our traffic drop last week?” You dig into the data and realize—oh yeah, that was the day we switched hosting providers and the site was down for 4 hours.
Now imagine if you had just marked that with a red annotation. Boom. Question answered.
Annotations save time, reduce confusion, and make collaboration easier.
2. Help Your Future Self
When you’re analyzing trends six months from now, you’re not going to remember every campaign or hiccup. But your annotations will.
They help you build a historical roadmap of your analytics data. That’s gold when you're reporting up the chain or planning future campaigns.
3. Spot Patterns Faster
Using color coding and consistent naming conventions means you can start spotting patterns at a glance. For example, if every green-dot paid search campaign leads to a conversion spike, you know you’re doing something right.
Or if every red-dot outage leads to a long recovery period, maybe it’s time to invest in site reliability.
4. Use It as a Training Tool
If you have new team members learning your analytics setup, annotations are a great teaching tool. They can go back in time and see what happened and when—giving them better context for the metrics they’re analyzing.
What’s Missing? (C’mon Google…)
Of course, no Google rollout would be complete without a couple of “what were they thinking?” moments.
No Annotations in Explorations
GA4’s Explorations feature is where a lot of the good analysis happens—custom funnels, detailed user paths, etc. Unfortunately, annotations don’t show up there. That’s a bummer.
Hopefully Google adds support for annotations in Explorations soon. For now, you’ll just have to manually cross-reference.
No Looker Studio Integration (Yet)
As of now, annotations don’t show up in Looker Studio dashboards either. So if you’re building reports there for clients or leadership, you won’t see those helpful dots.
Will this change? Hopefully. Google’s been slow to roll out Looker Studio improvements for GA4, but we’re staying hopeful.
Final Tips for Getting the Most from Annotations
Before we wrap up, here are a few best practices to help you get the most out of annotations in GA4:
✔️ Standardize Your Naming Conventions
Decide as a team how you’ll title events. Something like:
[Channel] - [Campaign Name] - [Purpose]
Example:
Email - March Spring Sale - Promo Launch
This makes it easier to sort and understand what each note means.
✔️ Set a Regular Cadence
Get into the habit of adding annotations regularly:
- Weekly marketing updates
- Monthly reporting recaps
- Big campaign launches
- Website changes or dev pushes
Make it part of your team’s workflow.
✔️ Collaborate Cross-Functionally
Encourage different departments—SEO, Paid Media, Dev, Email—to contribute annotations. The more eyes (and notes) on your analytics, the clearer your picture becomes.
✔️ Document Your Color Codes
If you’re using color coding (which you should!), put that legend somewhere easy to access—like a team wiki, project management board, or shared doc.
Annotations Are a Game Changer (Again)
After being sorely missed, annotations are back in GA4—and they’re as useful as ever. If you’re not using them yet, today’s a great day to start.
They’ll help your team:
- Understand what caused changes in your data
- Stay aligned across departments
- Improve reporting and analysis
- Save time by reducing guesswork
So go ahead—jump into your GA4 property and add your first annotation. You’ll be glad you did.
Need help with setting up GA4, Google Tag Manager, or getting your analytics strategy in shape?
Our team at Apotheca Marketing is here to help. We specialize in marketing data, implementation, and strategy—and we’d love to work with you.
Contact Us


