Google Analytics Users Defined: Active Users vs. New Users vs. Returning Users
Roy Bielewicz

Two of the main traffic metrics that businesses look at for their website performance are sessions and users. Sessions are the number of times people come to your site during a given period, while users are the “unique” visitors to your site, who may or may not have multiple sessions.
Unfortunately, as with many things related to
GA4, the definition of “user” isn’t as straightforward as one would think, which can cause some confusion in your reporting. So let’s clear this up.
What is a “user” in GA4?
At its core, a user is a unique visitor to your website during a given time period. In GA4 this metric is called “total users”. However, just because you see “user” in a GA4 report, doesn’t mean that you can assume that GA4 is reporting on total users, like you could in the previous version of Google Analytics, Universal Analytics. In fact, the total users metric in GA4 is a bit more difficult to find than you would expect.
Active Users in GA4
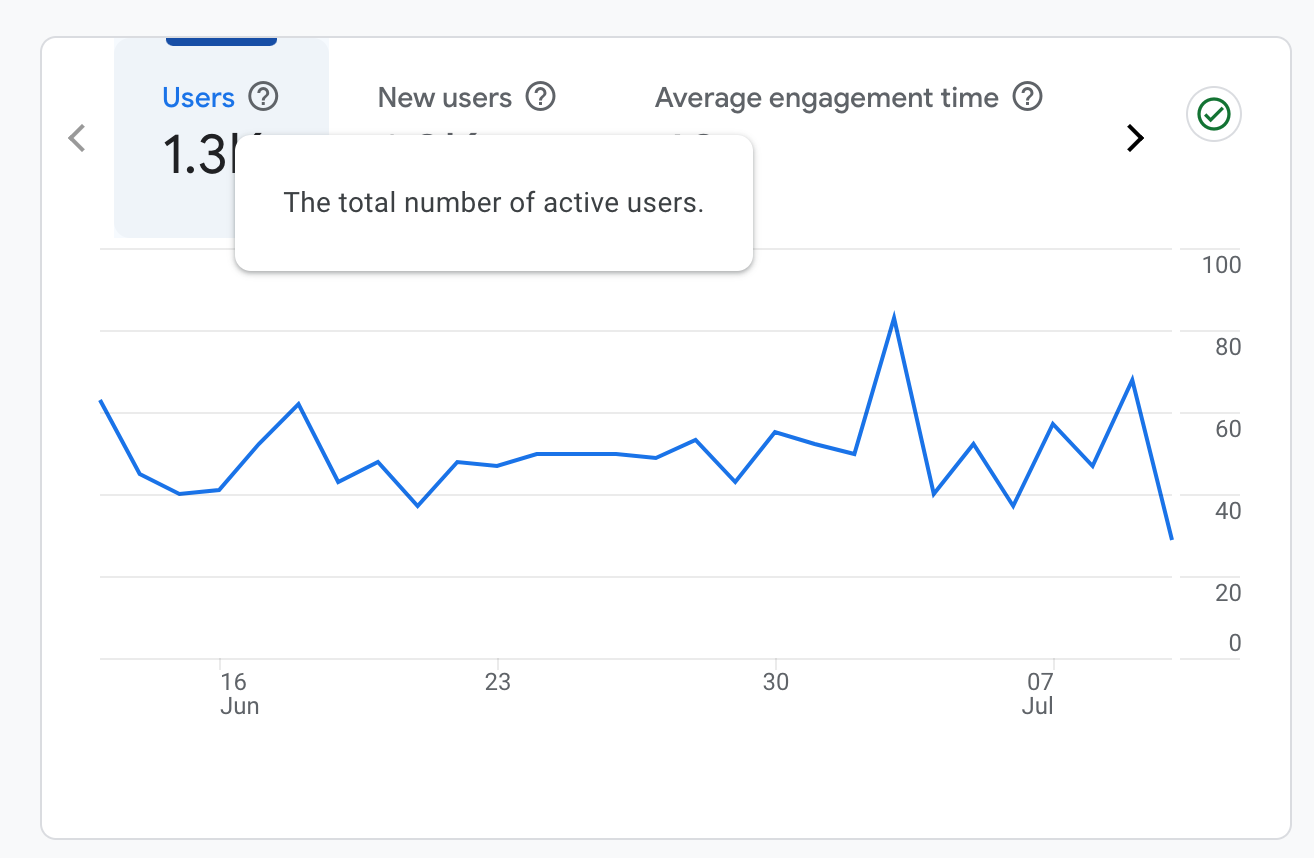
In the default dashboards in GA4, when you see “Users”, that metric is actually “Active Users”. Totally not confusing, right? The way you can test this is to hover over the column name in your reports, and Google will super conveniently provide you with the definition there. You know, rather than calling the column something radical like “Active Users”.
By definition, an active user is one who has “engaged” with your site or app. That means that the user has met one or more of the following conditions:
- Engagement Time: The session lasts 10 seconds or longer.
- Conversion Event: The user has triggered one or more conversion events.
- Page or Screen Views: The session includes two or more page views or screen views.
So in other words, Google is really focusing only on visitors to your site who didn’t “bounce” and immediately leave upon landing. That makes sense, but can be confusing if you’re using a metric like “total users” in your Looker Studio dashboards, or are comparing your data to other sources (including historical data from UA).
Total Users
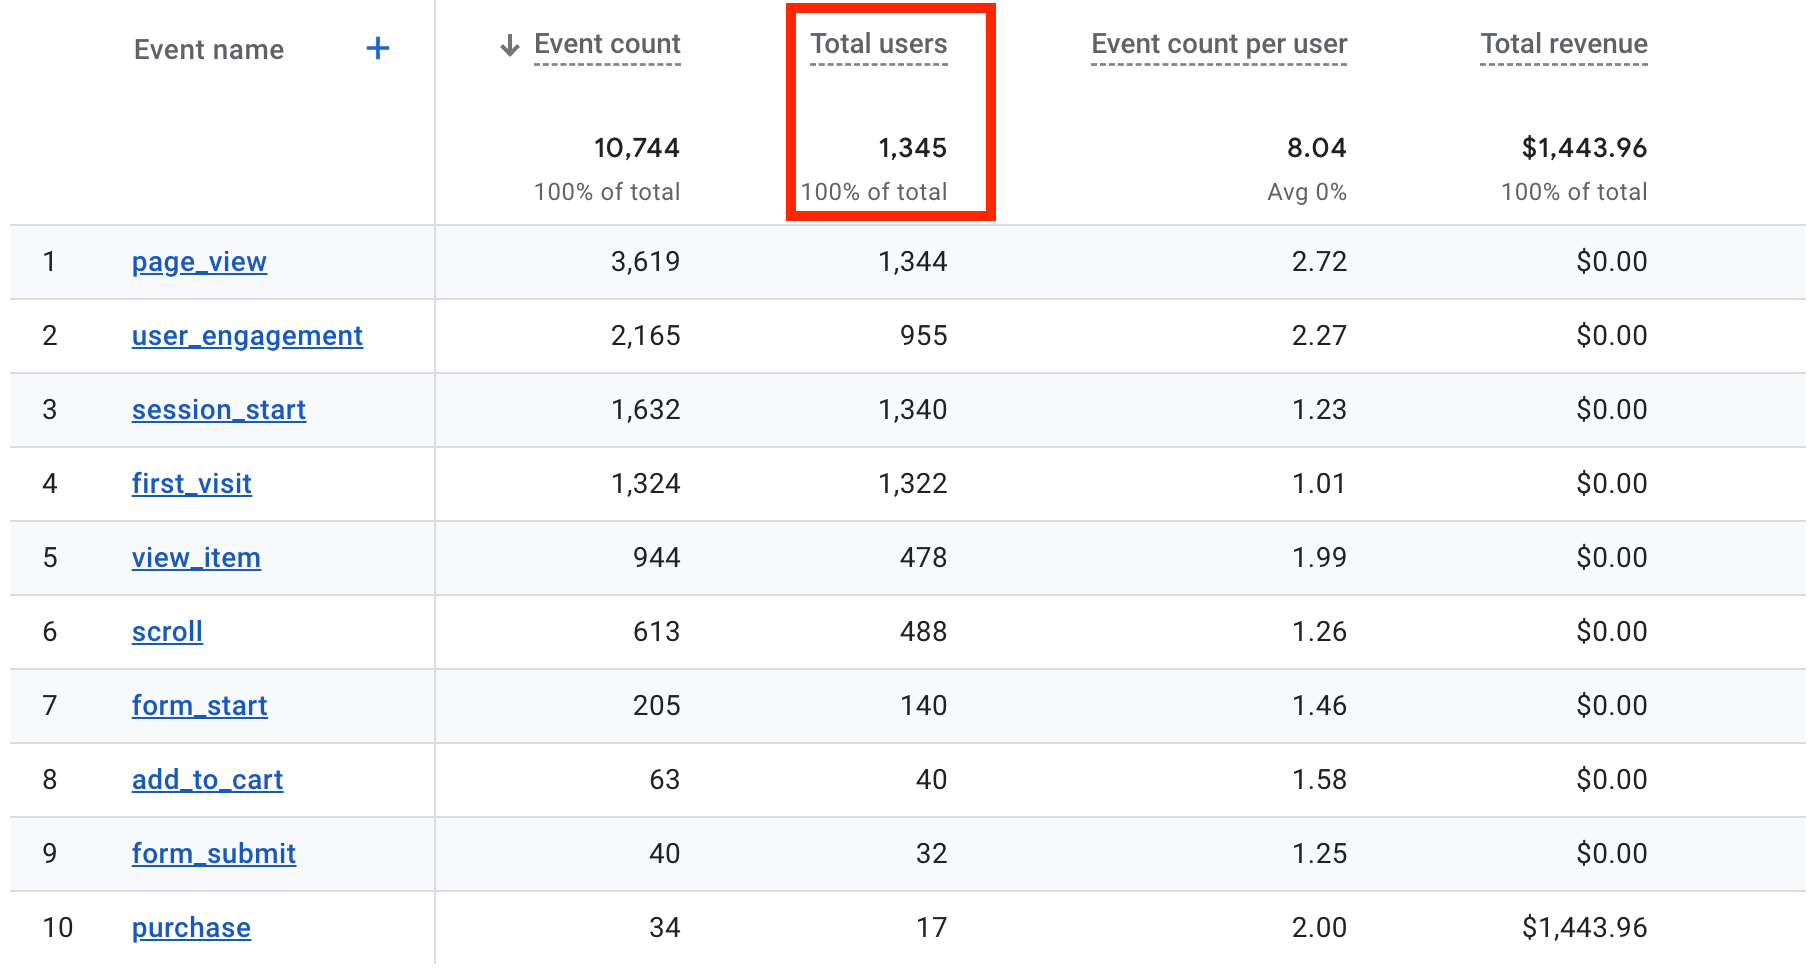
As we mentioned above, “total users” includes all visitors to your site during a given time period, who logged any event, such as page view, first visit, etc. Since the “Users” metric in GA4’s dashboards is actually “active users”, finding total users can be a bit more challenging.
You can find total users by going to Engagement and then Events, where you will see a sum of total users, as well as total users by event. You can also report on Total Users in Looker Studio (formerly Data Studio) dashboards.
Unlike in UA, you can’t assume that Total Users is the same as New Users plus Returning Users, which we’ll discuss below.
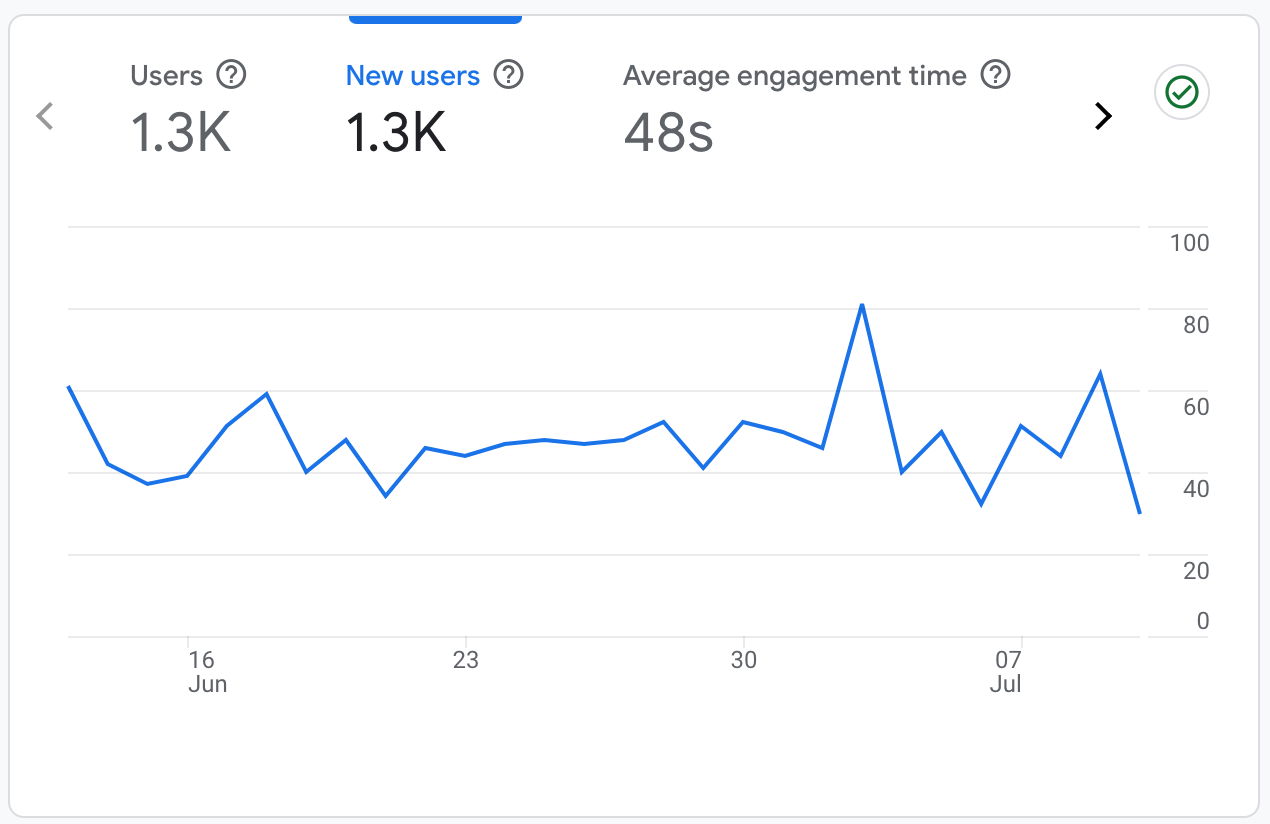
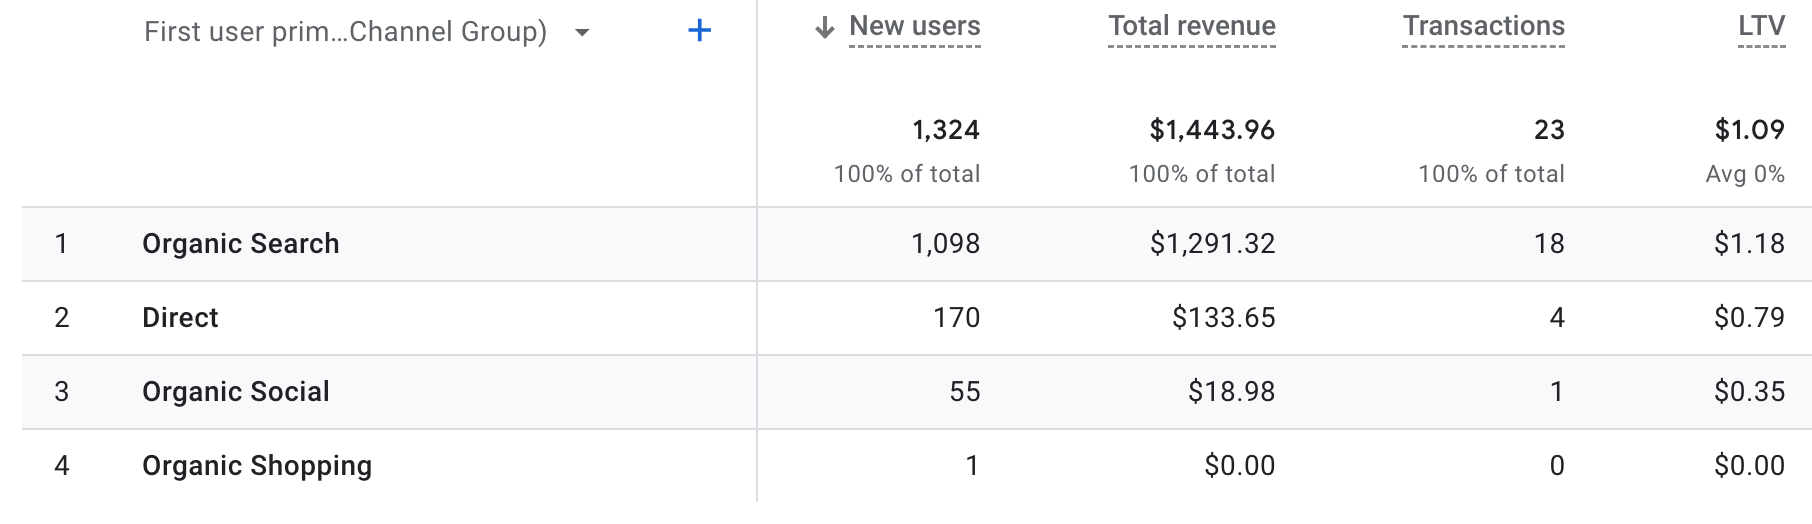
New Users
New Users are defined in GA4 as unique users to the site who have logged the first_open (measured on iOS apps) or first_visit (measured on websites and Android apps) event in the date range that you’ve selected. In other words, as far as GA4 can see, this user hasn’t been to your site before because a pre-existing cookie isn’t on their browser.
You can see these and other events that GA4 is tracking by going to Reports, then Engagement, and then clicking on Events. You can also go to Admin, then click on Events or Key Events under the “Data display” section. There you will event counts rather than the user data under the standard reports section.
New User metrics can be seen in the main dashboards in GA4, but you can also add this metric to other reports, such as your Acquisition reports such as Traffic Acquisition. There is also a report in the Acquisition section called User Acquisition Cohorts that focuses on New Users.
One of the shortcomings of this metric is that If a visitor has interacted with your site but is coming to your site from a different browser, computer, or device, they may appear as “new” even though they aren’t in reality.
Keep in mind that not all new users are active users, since some may “bounce” from your site. Because of this “new users” in your reports will often exceed the number of active users, but it will never be greater than total users.
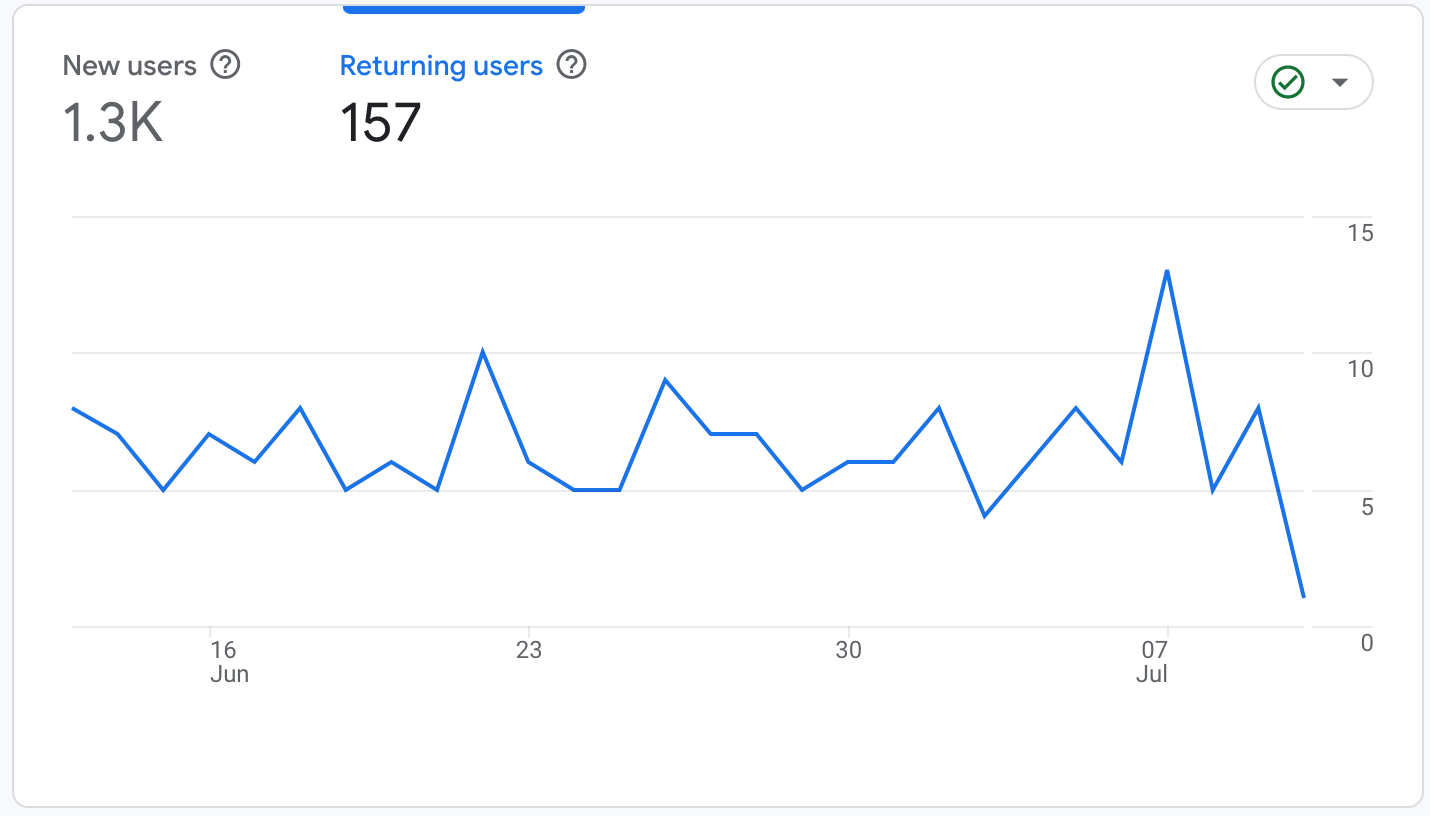
Returning Users
As the name implies, Returning Users are unique users who have visited your site before. GA4 defines them as “The number of unique users who initiated at least one previous session, regardless of whether or not the previous session was an engaged session, in the specified date range.” In other words, while GA4 doesn’t show a lot of love for inactive users, it does count that inactive visit towards your status as a returning user.
You can find information about returning users in GA4’s standard reports by going to Reports, then Life cycle, then Retention.
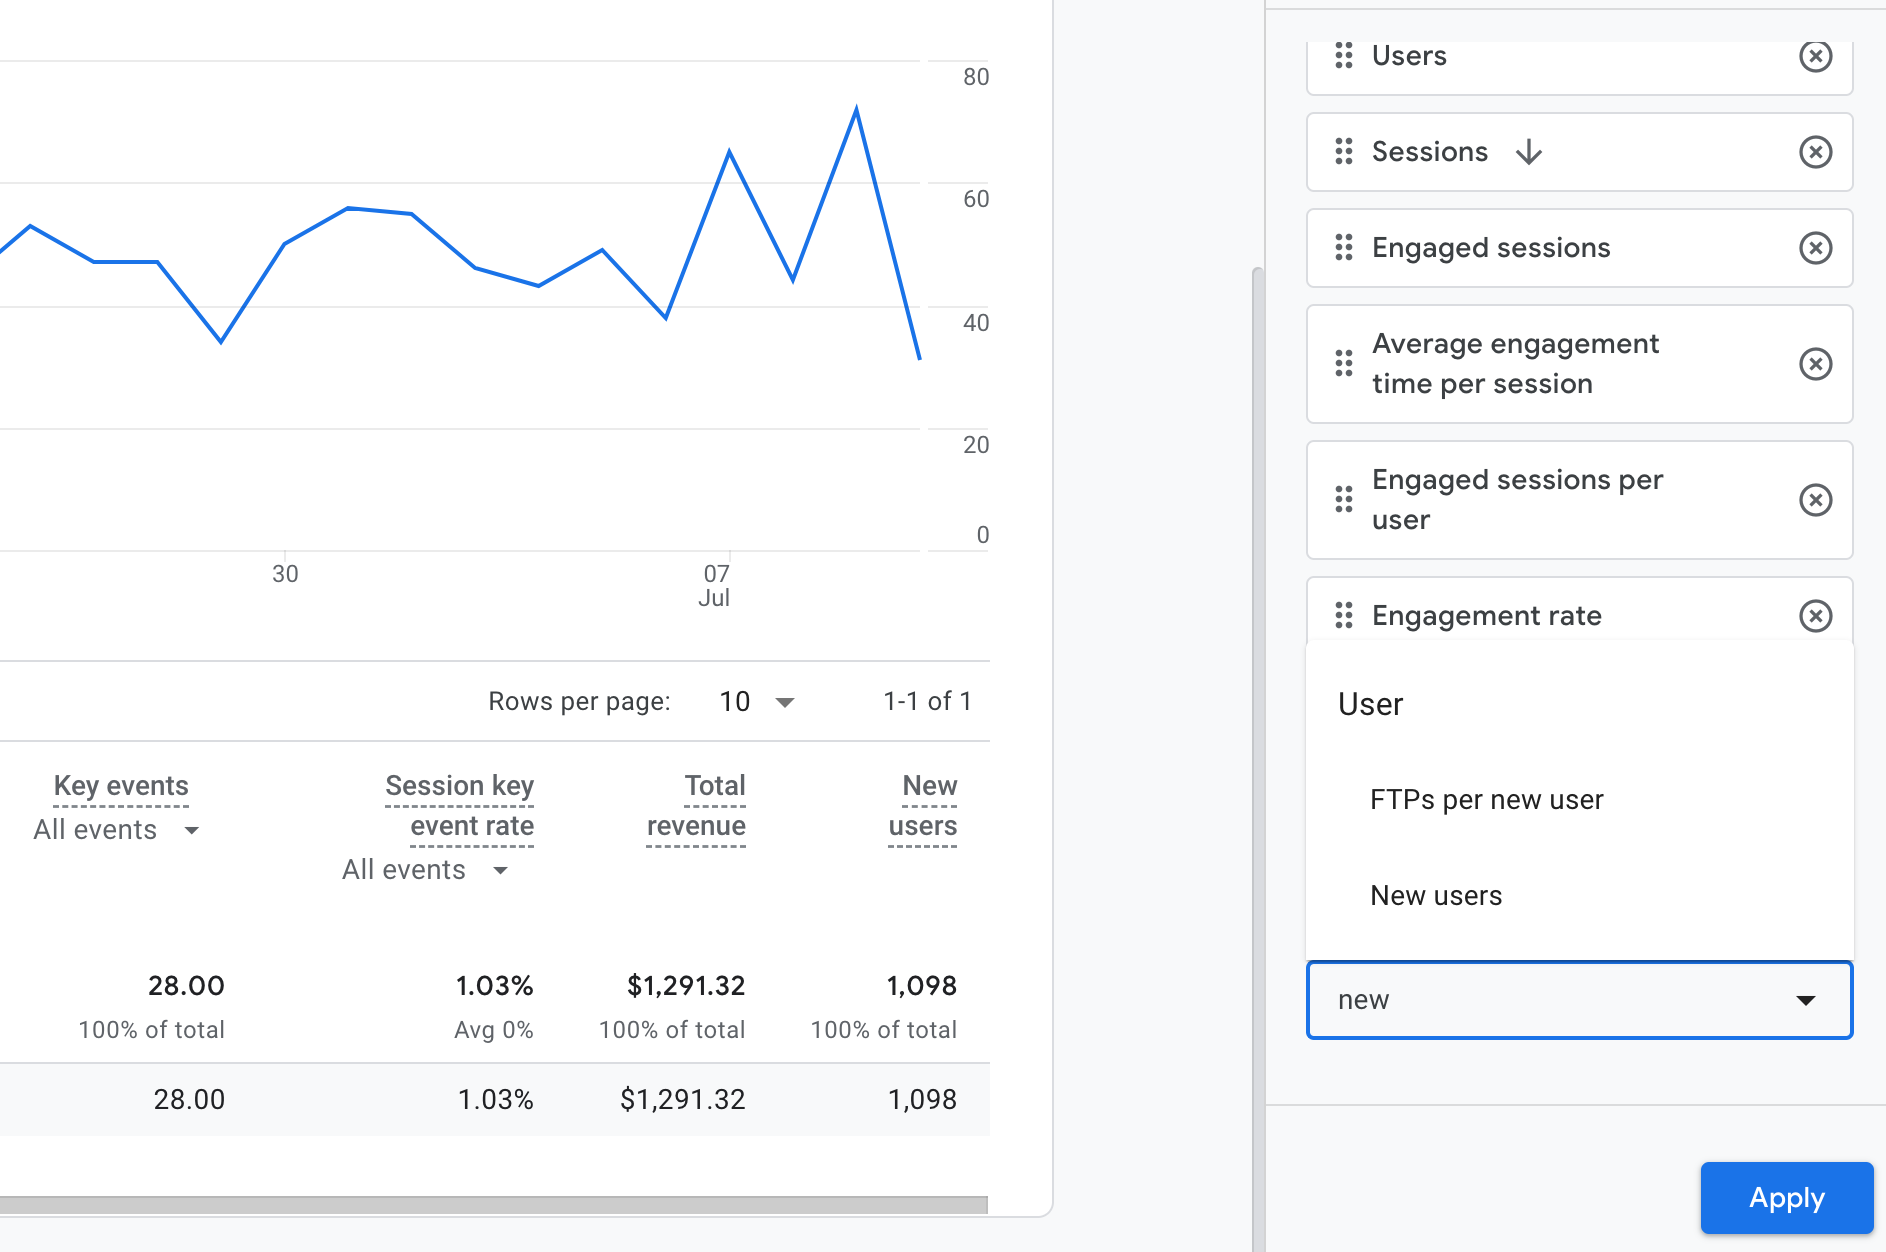
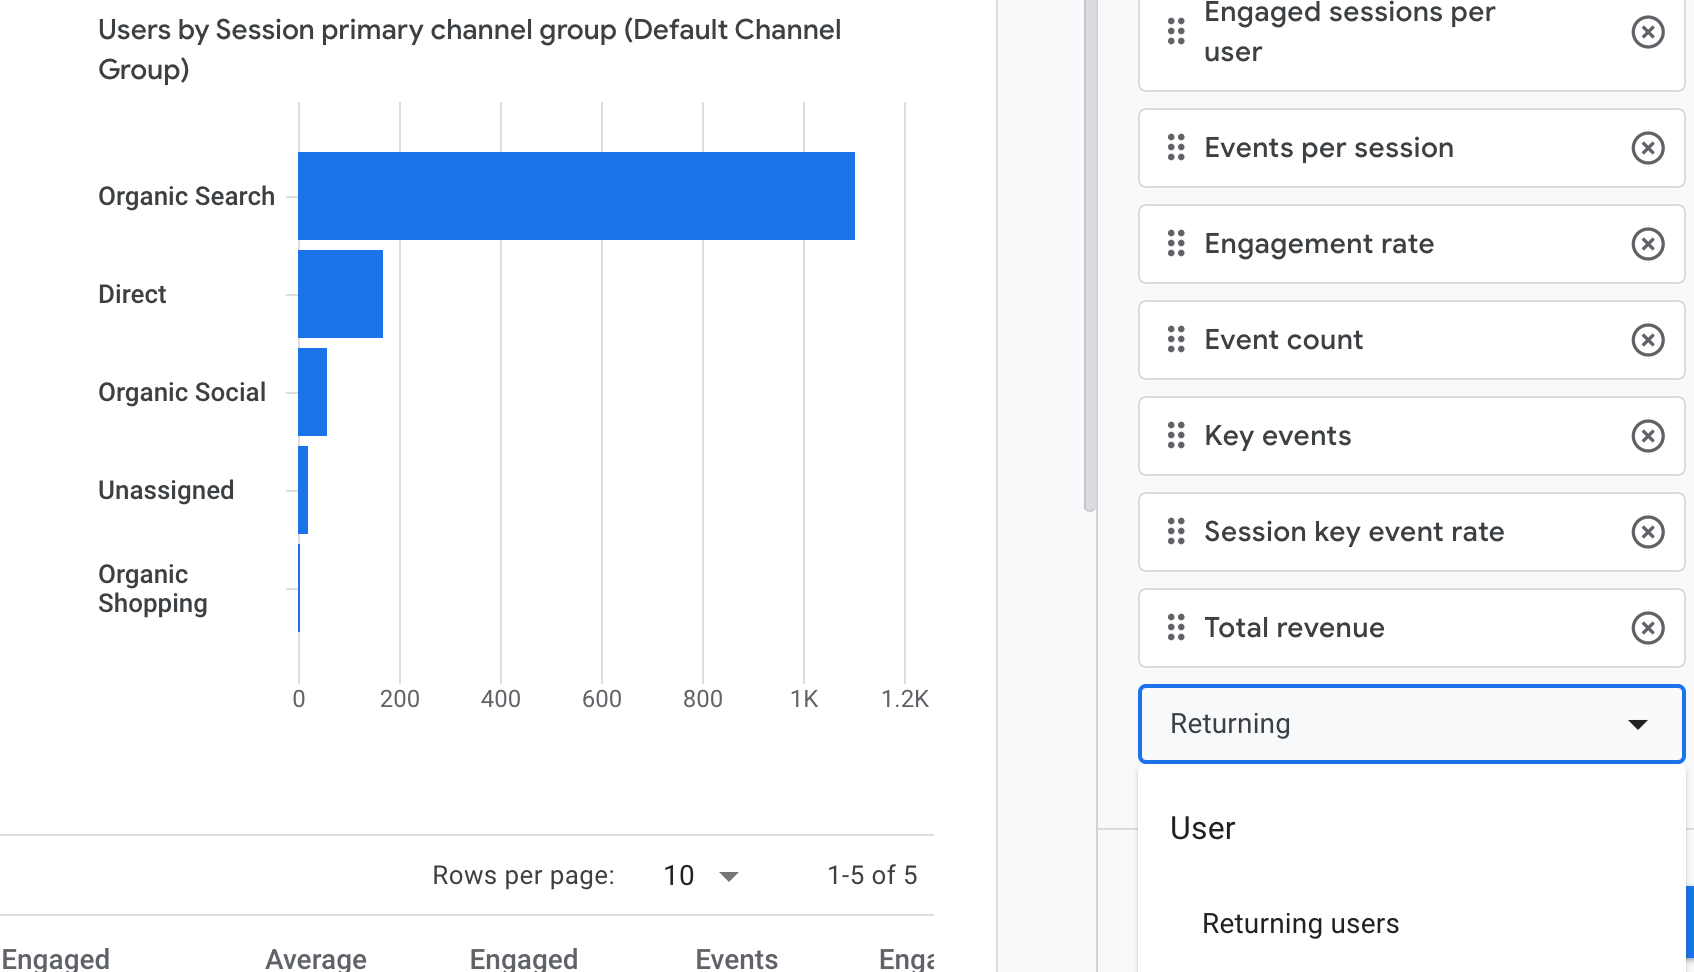
You can also add a returning user column by customizing your report. For example, if you go to Life cycle, then Acquisition, then Traffic Acquisition, you can click on the pencil icon in the upper right (if you have the correct permissions).
After clicking on the pencil icon, click on Metrics, and then Add metric. Search for “returning users” and select it. You can now click “Apply” and then save the report.
Creating Audiences
Ok, so knowing how many people are visiting your site is great and all, but how can you use this in your marketing? You can create audiences that you can use to target your ads!
If someone has come to your site, it’s a great opportunity to retarget them if they haven’t converted. By creating an audience of returning visitors, or visitors who haven’t converted, you can create remarketing ads in Google Ads to promote specific products, services, promotions, or just remind them that they should come back and convert.
We have an in-depth video that shows you how to do this in GA4 here:
https://www.apothecamarketing.com/creating-audiences-in-google-analytics-4

Contact Us